Optimizing in Vitro T Cell Culture: A Step-by-Step Experimental Protocol
May 29,2026
Developing efficient in vitro T cell culture systems that generate highly functional, low-exhaustion T cell populations is essential for progress in immunotherapy, oncology, autoimmune diseases, and infectious disease research.
In this issue of Cell Culture Academy, we systematically outline the core workflows and critical considerations for in vitro T cell culture to help improve experimental consistency and reliability.
I. Introduction to T Cells
T cells are key effector cells of the adaptive immune system that mediate pathogen clearance, antitumor immunity, and immune homeostasis. T cells are characterized by CD3 expression and are broadly classified into the following functional subsets:
Helper T cells (Th)
Helper T cells coordinate immune responses by secreting cytokines such as IL-2 and IFN-γ, which activate B cells, macrophages, and cytotoxic T cells.
Cytotoxic T cells (Tc)
Cytotoxic T cells eliminate target cells through perforin- and granzyme-mediated apoptosis and are major effectors in antiviral and antitumor immunity.
Regulatory T cells (Tregs)
Tregs suppress excessive immune activation, maintain immune tolerance, and prevent autoimmune responses, serving as essential regulators of immune homeostasis.
Memory T cells
Memory T cells are generated following antigen exposure and persist long term, enabling rapid and enhanced immune responses upon re-exposure to the same pathogen.
In vitro, quiescent T cells do not proliferate autonomously. Their activation requires three coordinated signals:
Signal 1 (antigen recognition): Engagement of the T cell receptor (TCR/CD3) with peptide-MHC complexes on antigen-presenting cells (APCs), enabling antigen-specific recognition.
Signal 2 (costimulation): Interaction between CD28 on T cells and ligands (CD80/CD86) on APCs, providing the necessary costimulatory input for full T cell activation and enhanced immune responses.
Signal 3 (cytokine signaling): Cytokines such as IL-2 bind to their cognate receptors on T cells, sustaining signaling that drives activation and proliferation.
II.T Cell Isolation and Culture
1. PBMC Isolation
Mix peripheral blood 1:1 with PBS and layer the diluted blood over Ficoll-Paque. Centrifuge at 2,000 × g for 20 min (brake off).
Collect the PBMC layer from the plasma-Ficoll interface (Figure 1).
Wash isolated PBMCs twice with PBS by centrifugation (300 × g, 10 min).
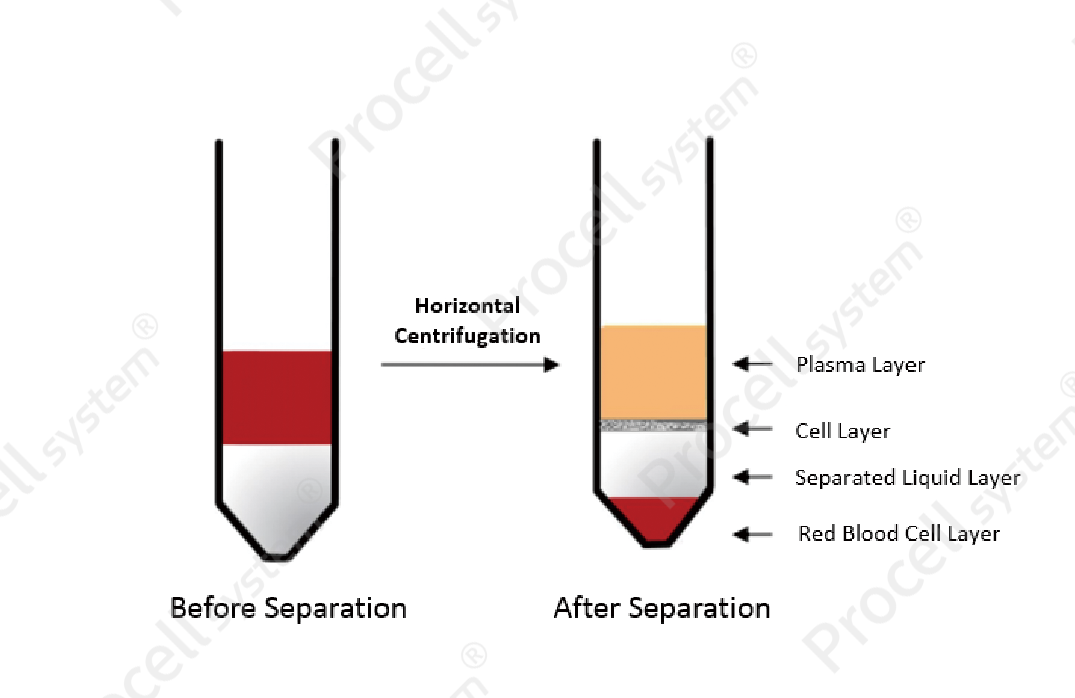
Figure 1. PBMC stratification after density gradient centrifugation.
T Cell Enrichment
T cell enrichment typically employs magnetic bead sorting, targeting T cells via CD3 or CD4/CD8 surface markers or depleting non-target cells from PBMCs to achieve high-purity isolation.
Notes:
Maintain single-cell dispersion prior to sorting. For clumps, gently dissociate cells by pipetting and filter through a 200 μm mesh to eliminate aggregates and debris, enhancing purity and yield.
After resuspension, quantify cells and adjust the cell concentration to the manufacturer-recommended density for optimal sorting.
Enriched T cells remain quiescent and require in vitro activation to initiate proliferation.
T Cell Activation
T cells are commonly activated in vitro using either soluble anti-CD3/CD28 antibodies or antibody-coated plates.
A. Soluble Antibody Stimulation
Add soluble anti-CD3/CD28 antibodies to the culture medium. Seed T cells and culture for 48-72 h before medium refreshment.
B. Antibody-Coated Plate Stimulation
Coat plates with anti-CD3/CD28 antibodies at 4℃ overnight, then wash three times with PBS. Add medium and T cells, and culture for 48-72 h before transfer to non-coated plates.
IL-2 supplementation is typically required to support sustained T cell proliferation.
T Cell Expansion
In vitro T cell expansion typically requires approximately 14 d and can achieve a tens- to hundreds-fold expansion. During culture, fresh medium should be added every 2-3 d to maintain a cell density of approximately 1 × 10⁶ cells/mL and prevent density-dependent cell death.
T Cells Identification
Following activation and expansion, T cell purity and activation status are evaluated. Microscopy revealed prominent cell clustering, consistent with proliferative activation (Figure 2), while flow cytometry typically shows up to 99% CD3⁺ purity.
Analysis of activation markers demonstrated low CD69 expression and high CD25 (IL-2 receptor α-chain) expression, indicating progression from early activation to sustained proliferation (Figure 3).
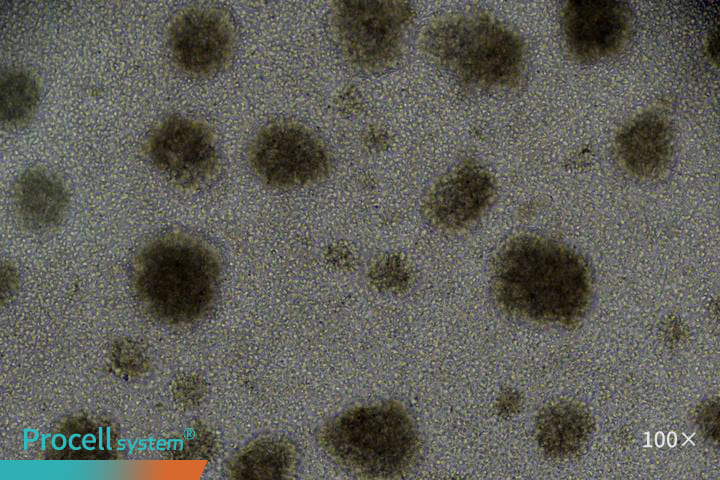
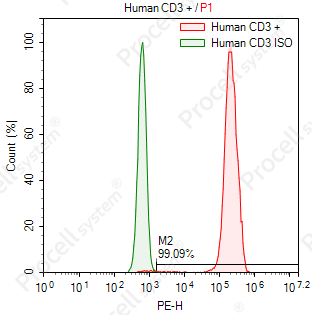
Figure 2. T cell morphology and CD3 expression analysis (left, bright-field microscopy; right, CD3 flow cytometry)
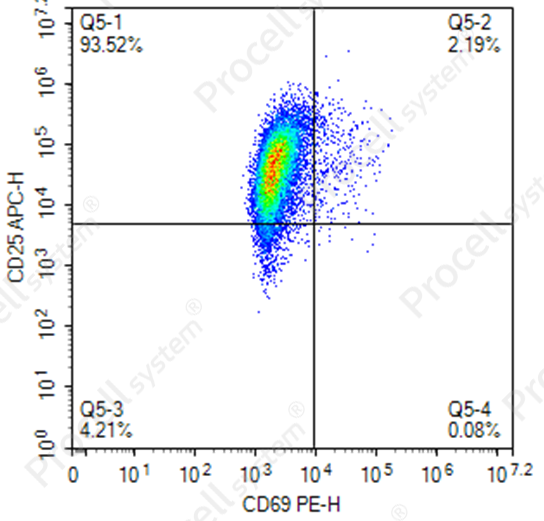
Figure 3. Flow cytometric analysis of T cell activation markers CD25 and CD69
III. Cryopreservation and Thawing of T Cells
Cryopreservation
Centrifuge T cells and resuspend in cryopreservation medium containing 10% DMSO.
Adjust the cell density to 1×10⁶-1×10⁷ cells/mL.
Aliquot into cryovials and perform controlled-rate freezing.
Store at −80℃ overnight, then transfer to liquid nitrogen for long-term storage.
Thawing
Pre-warm a 37℃ water bath and prepare complete culture medium.
Rapidly thaw cryovials in the water bath with gentle agitation.
Immediately transfer cells to a 15 mL conical tube containing 5 mL of pre-warmed medium. Centrifuge to remove the supernatant and resuspend cells in fresh complete medium.
Seed into culture vessels and incubate at 37℃ with 5% CO₂ under humidified conditions.
Prev: 2D vs 3D Cell Culture: Demystifying Core Tumor Models for Modern Cancer Research
Next: Practical Strategies for NK Cell Culture and Cryopreservation